One lost signal, five days stuck, 45,000 frozen threads: fixing a gVisor hang upstream
One lost signal hangs pod deletion. The maintainer's smaller fix was the better one.
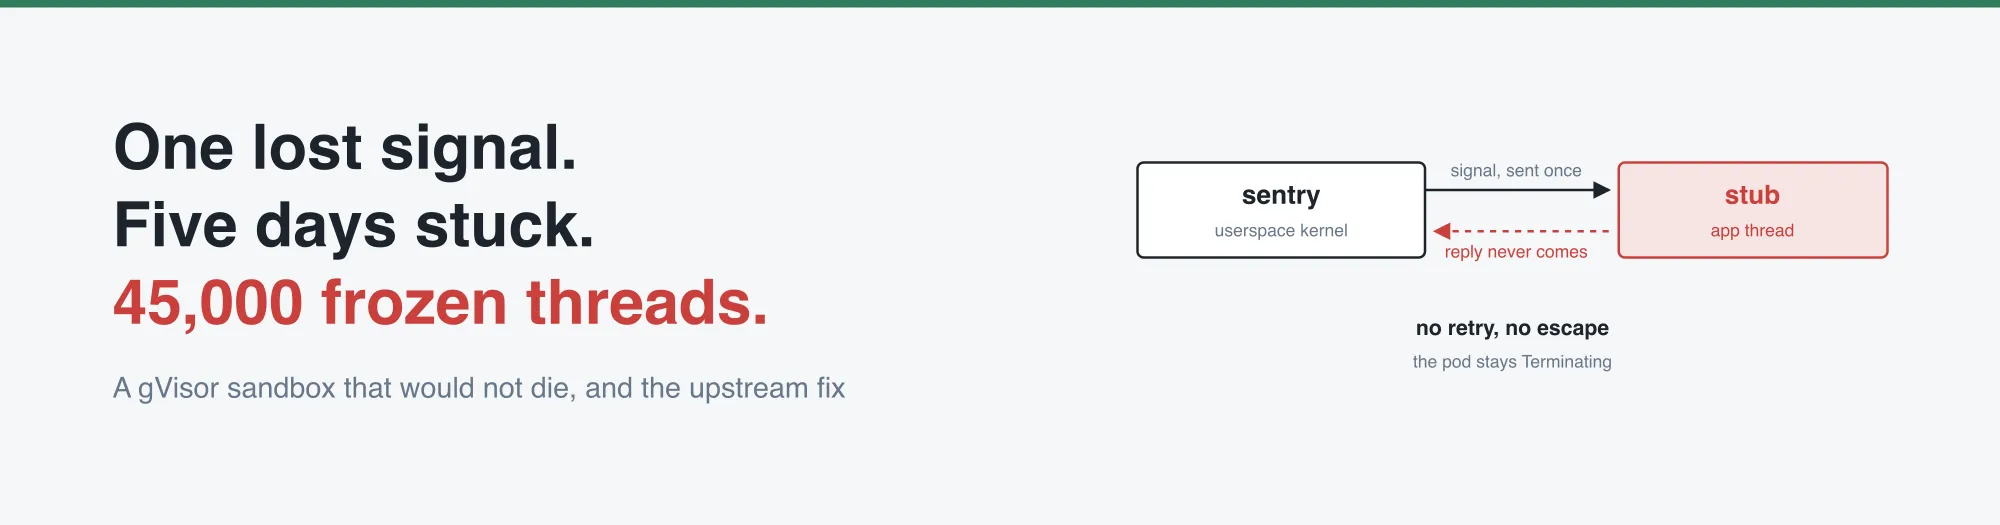
It looked like a deadlock in gVisor. It was a single missed wake-up, hiding behind a symptom teams have been reporting since 2021, and two strangers and a maintainer fixed it in about a week.
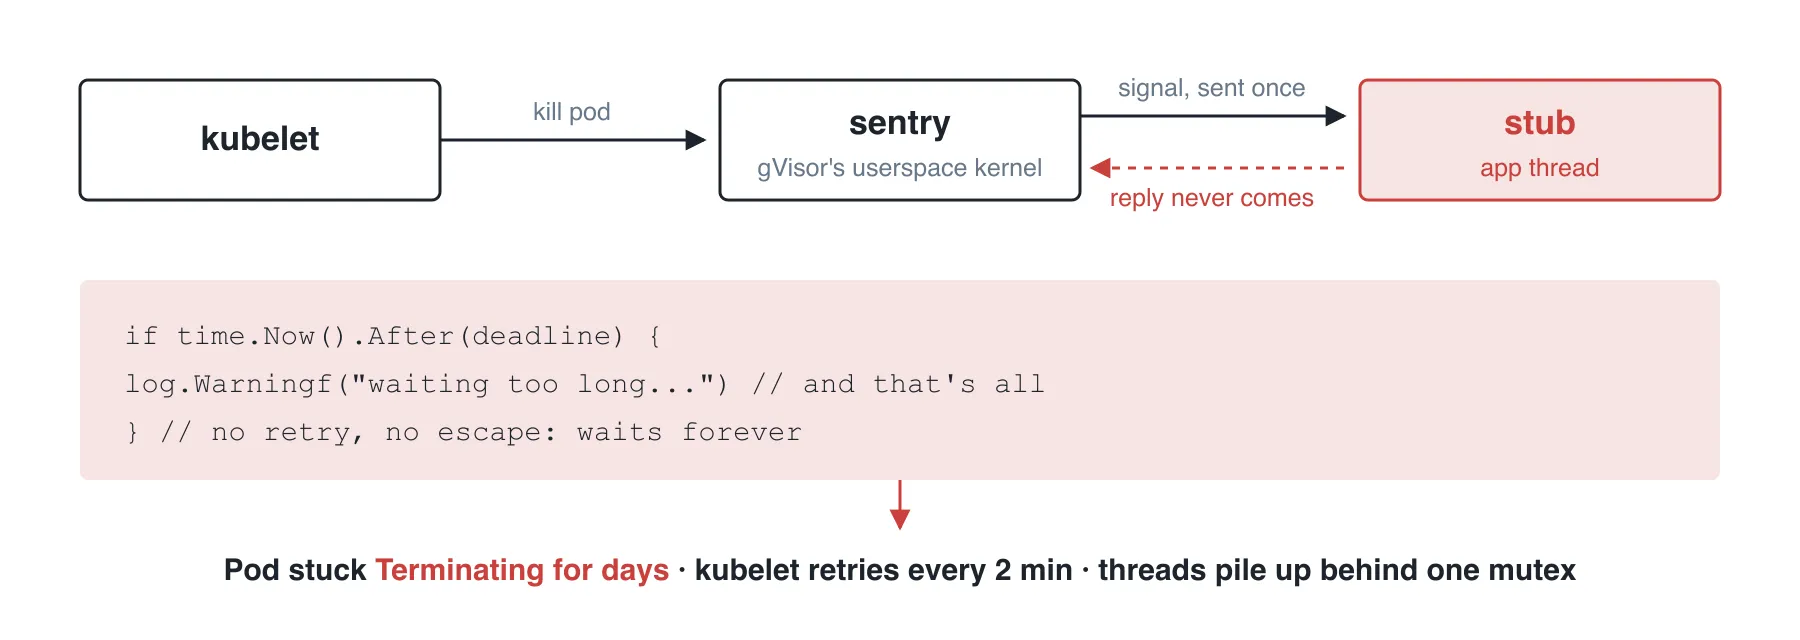
The hang in one picture: one signal, no retry, and a deadline check whose only action is a log line.
On a Tuesday morning our alerting claimed that 559 pods were stuck Terminating in production. The real number was one. The rule counts kubelet failed-kill events rather than pods, and a sandbox that never dies gets retried forever, so a single wedged pod read as a fleet on fire. That pod turned out to be the interesting part.
At Wix, our Velo grid runs users' backend JavaScript as untrusted code inside gVisor sandboxes on Amazon EKS. gVisor puts a userspace kernel between that code and the host kernel, so untrusted code never talks to the host kernel directly. Close to two thousand sandboxes per node group, short lifecycles, heavy churn. Deleting a pod should take seconds. This one had been Terminating since 07:11. kubelet's kill requests got DeadlineExceeded every 2 minutes and would have continued forever. We intervened by hand after about 90 minutes. A week earlier, eight pods on four nodes had sat like that for days.
Why nobody's timeout saved us
Before the forensics, the shape of the problem. Deleting a pod is a relay: each layer asks the next one, politely, to make something die. Every layer should hold two more things beyond the polite ask: a bound on how long it waits, and an escalation that works without the cooperation of the thing it is waiting on. In our case the relay runs from kubelet (the Kubernetes node agent) to containerd (the container runtime) to the gVisor shim (the per-sandbox process containerd talks to) to the sandbox itself. Here is that stack, graded on all three:
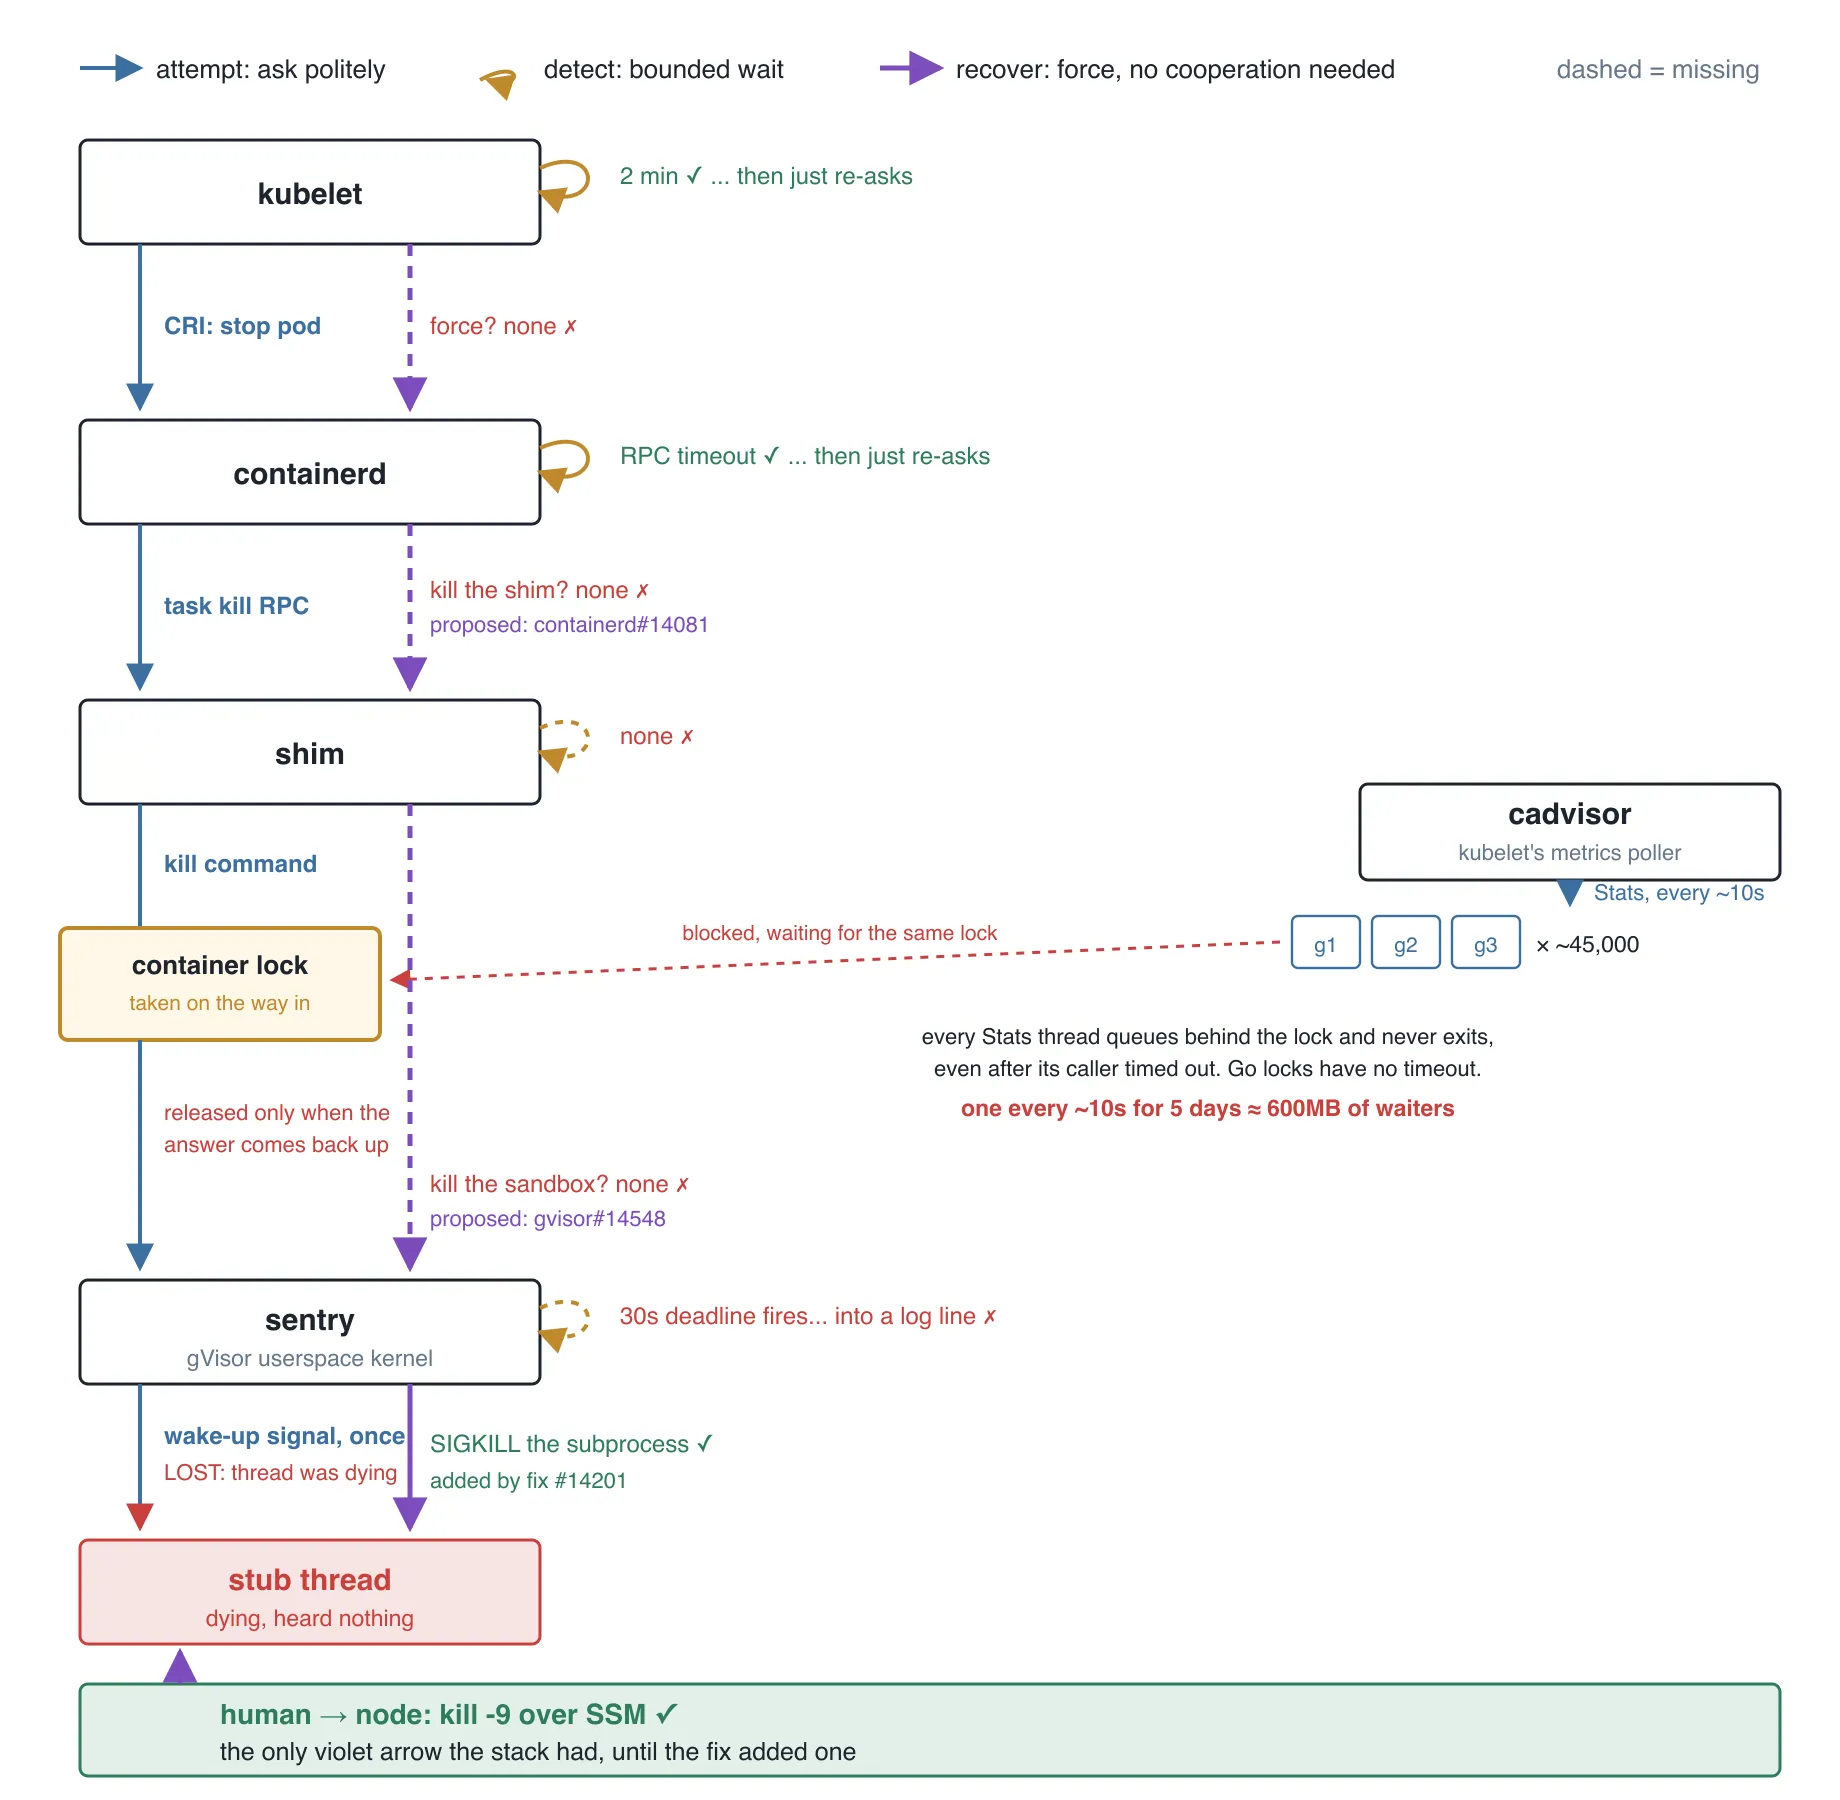
Three arrows per hop: blue attempts, amber detects, violet recovers. Blue failed once, at the bottom. Amber either did not exist, fired into a log line, or fired and could only re-send blue. Violet existed nowhere, so one lost message at the bottom of the stack became the whole stack's hang.
Look at the violet column. Every escalation asked the very component being escalated against to cooperate. containerd's dead-shim cleanup only fires when the shim disconnects. Ours kept answering Connect and State, which never touched the lock, while Kill and Stats blocked behind it. The connection stayed up, so cleanup never fired. Alive enough to prevent its own cleanup.
What a frozen sandbox looks like
That userspace kernel is called the sentry. On systrap, the platform we run, the app's threads run in stripped-down stub processes and the sentry coordinates them. Our wedged pod had a sentry that was alive but answering nothing. runsc kill, gVisor's own command for stopping a sandbox, hung. runsc debug --stacks, the tool that is supposed to tell you why something hangs, also hung. The panic log was 0 bytes.
The node told the rest of the story. Load average climbing about 3 per hour while actual CPU sat near 30%. Hundreds of sentry threads parked, waiting on shared memory. Stub processes accumulating. On the worst nodes, load kept climbing for days with the machine mostly idle. The only remediation that worked was SIGKILL to the whole sandbox process tree, by hand, over AWS SSM, a remote shell into the node. That became a runbook. Runbooks like that are a debt.
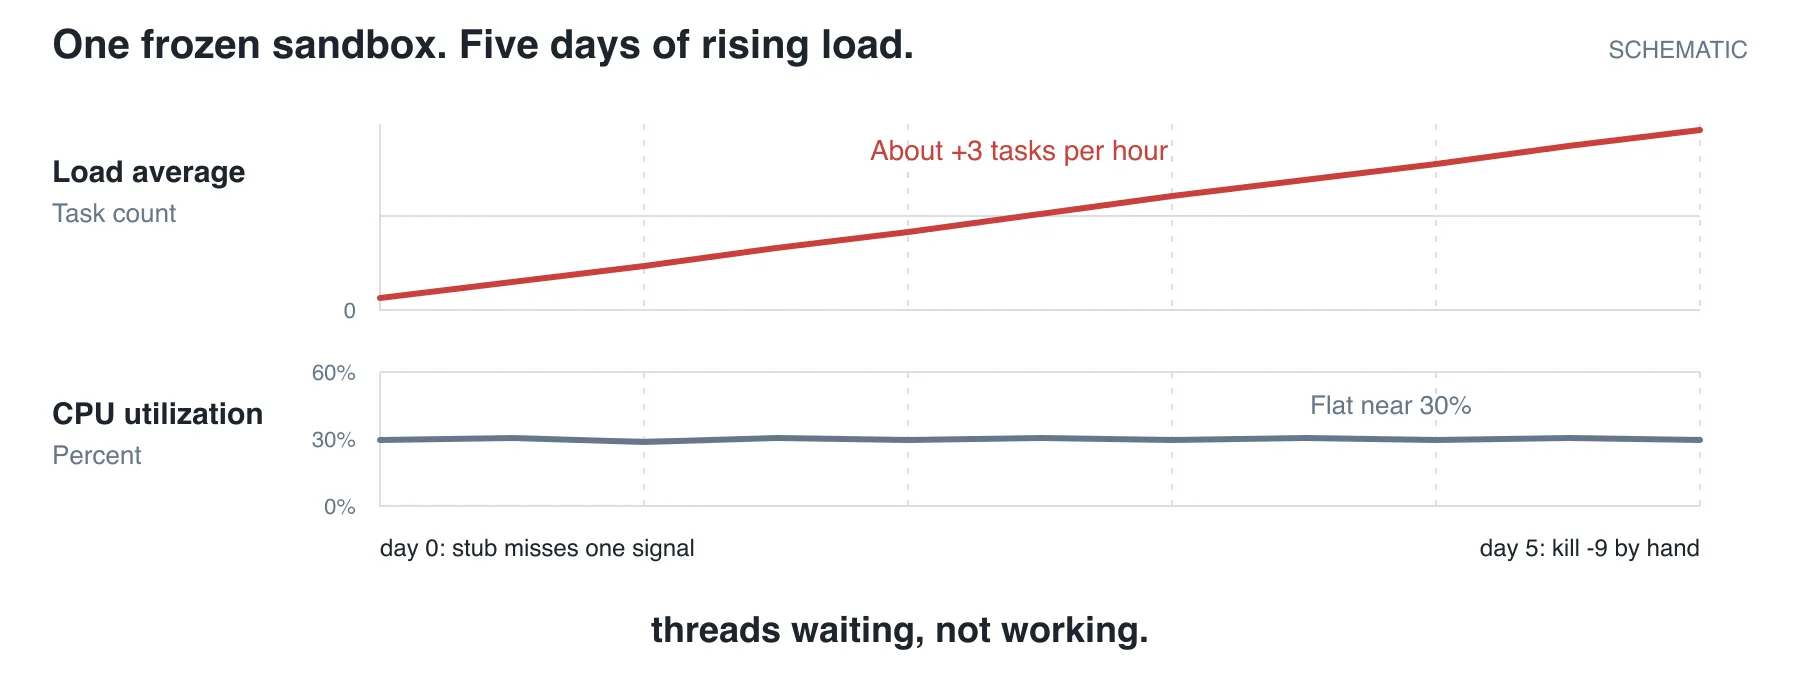
Stub processes pile up behind the frozen sentry: load average keeps climbing while the CPU does almost nothing. Threads stuck waiting, not working: the rising top panel against the flat bottom one is the bug.
So we filed gvisor#14408 with what we had: the outside view, two affected releases, and an honest admission that we could not get stacks because the debug tooling was wedged along with the sandbox. Our proposed fix, PR #14201, had been open since the week before.
Then a stranger showed up with the other half
The same day, another engineer filed gvisor#14405. Same bug at a different company, and they had the one thing we could not get: a full dump of the sentry's goroutines, Go's lightweight threads, from inside a frozen sentry. Their dump showed one of the sentry's internal worker threads sitting in the same wait loop for over five days, waiting for a stub thread that had missed a single wake-up signal.
In their shim, about 45,000 waiting threads were queued behind one lock held by a kill that would not finish, and their containerd and kubelet memory grew until nodes ran out.
The bug itself is painfully simple. The sentry sends the stub one interrupt signal. One. If that signal is lost, and nobody has yet pinned down why it sometimes is, the sentry keeps waiting for the answer with no retry and no escape. There is even a 30 second deadline in the code that notices the wait is too long. Here is the whole thing it did about it:
if time.Now().After(deadline) { log.Warningf("Systrap task goroutine has been waiting on " + "ThreadContext.State futex too long. ...") // no retry, no escalation }
Where did 45,000 waiting threads come from? cAdvisor kept polling every container's Stats. Each request added a goroutine that blocked behind the hung kill's lock. Its caller timed out, but a mutex wait cannot observe cancellation, so the goroutine stayed. Over five days, 45,000 accumulated: roughly one every 10 seconds, the scrape interval fossilized in a thread dump. The metrics system asking "how are you?" every 10 seconds had pushed the shim to about 600MB.
A timeout that only logs a warning is not a timeout. It is a diary.
And this exact wait sits on the teardown path. Killing a sandbox starts with a freeze-everything step that waits for every worker thread to park, so one stuck worker means the kill command can never answer, the shim call hangs, kubelet gets DeadlineExceeded, and each retry parks another goroutine behind the first one. The pod stays Terminating for days.
So, how did we fix it?
The merged fix escalates in stages, gentlest first:
1. Tap again. The interrupt is resent on each 5 second checkup wakeup instead of once. When the resend lands, a lost signal costs the workload a stall of a few seconds, then it carries on.
2. Photograph the scene. If the stub is still unresponsive after the 30 second deadline, the sentry dumps every internal stack trace to the log. A frozen sandbox can not be debugged from outside unless it was started with --panic-signal; ours were not, theirs were, which is where their dump came from. So this failure now documents itself. The next team to hit anything like this gets for free what took two companies a week to assemble.
3. Remove only the broken part. Then the sentry kills just the one stuck subprocess, through the same path it already uses when a stub dies naturally. The blocked task unwinds, teardown can finish, and the healthy subprocesses in the sandbox are untouched.
Update, 1 Oct 2026: a gVisor maintainer reported that step 3 also hits healthy subprocesses. A host page fault that takes more than 30 seconds, for example on a slow FUSE server, looks the same as a lost signal, because the stub cannot take the interrupt until the fault returns. gvisor#15182 keeps the resend and the stack dump, and kills only when the stub thread no longer exists, not after 30 seconds. It is in review.
My first version killed the entire sentry. gVisor maintainer Konstantin Bogomolov pushed for killing only the stuck subprocess, sparing healthy neighbors. He was right. The other reporter had raised the same concern earlier that day. Konstantin also caught a dropped continue, which led me to a race: a context that recovered during the wait could still get killed. Three review rounds in under a week took the PR from nobody having looked at it to merged on master.
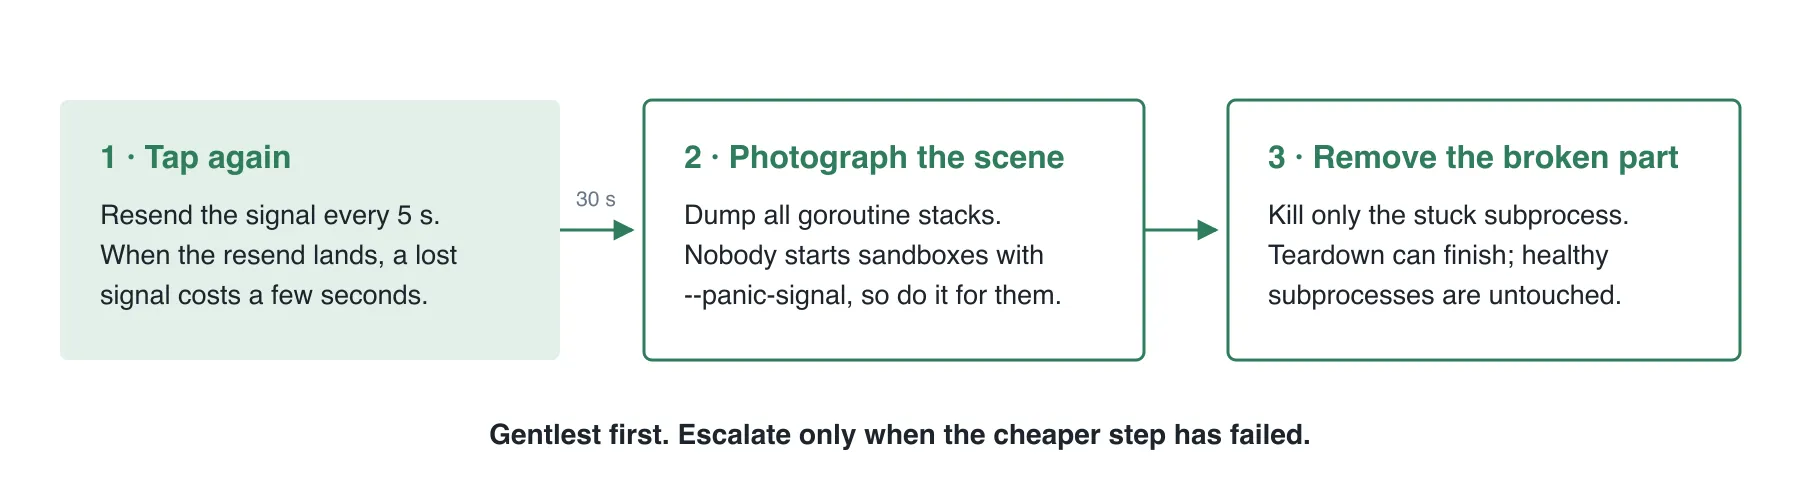
The merged fix, staged from least to most disruptive. My first version jumped straight to killing the whole sandbox; review scoped it down.
The part that bothers me
After the merge, we found reports since 2021 from a Cloudflare engineer, a GKE user, Knative, Talos Linux, Arista and others on the containerd tracker. Roughly eight teams over five years. Causes differed, and some cases got fixes. But the pattern kept returning: pods stuck Terminating, debugging tools hanging, someone killing processes by hand, and more often than not the thread ends without a stack trace from inside the sandbox.
Two teams filing in the same week broke that pattern: our production evidence and proposed fix met the other team's internal stack dump.
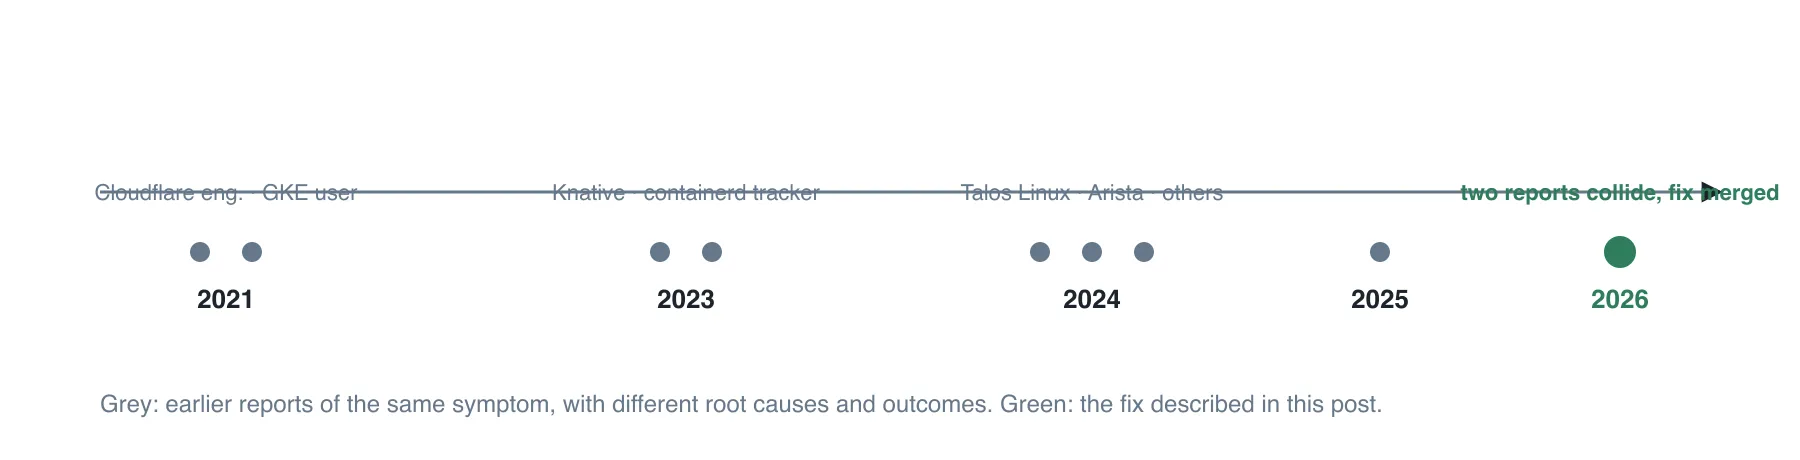
Five years of the same symptom, with different root causes underneath. Most threads ended with the manual workaround, until two half-reports completed each other.
The relay diagram near the top of this post still isn't fully green. The merged fix repairs the layer where the hang started. We filed gvisor#14548 to bound shim kill waits, then SIGKILL the sandbox tree, and containerd#14081 to SIGKILL the shim after repeated kill RPC timeouts. In review of the shim PR, gvisor#14549, the same maintainer asked to narrow it to bounded waits on Kill, Stats and Status, because killing the sandbox from the shim would take out healthy containers too, the same over-reaction he flagged in the first fix. That revision merged, and escalation stays open. Either escalation, as originally filed, would have capped our incident at minutes.
Lessons learned
- A watchdog that only barks is not a watchdog. If code detects a should-never-happen state, it must act: retry, self-report, fail. Grep your own codebase for deadline checks whose only body is a log line. This one surfaced because a sandbox sat stuck for five days behind it.
- File the issue even with half the evidence. Our report had no stacks and said so plainly. Within a day a stranger's independent report supplied them, and their dump changed the fix. The half-report you are embarrassed to file is someone else's missing half.
- Remediate the smallest thing that unblocks you. Kill the subprocess, not the sandbox. The instinct under pressure is the big hammer. Review cut the kill from the whole sentry to one subprocess. The same restraint belongs in your incident runbooks.
- Audit your escalation paths for circular dependencies. Walk your stack with that diagram's two questions: bounded wait, and escalation that works without the target's cooperation. If the answer to the second bottoms out at "a human with SSH", write that down, because that is your actual design.
The fix shipped in gVisor release-20260831.0. Until our fleet is on it, the SSM kill runbook stays, but this one has an ending, and the next report of this hang will arrive with its stacks attached.
This post was written by Nahum Litvin.
References
- Original First published on LinkedIn
- PR · merged google/gvisor#14201: systrap: fail-stop sentry on stuck context
- issue · closed google/gvisor#14405: systrap: sleepOnState() never returns when a stub thread is unresponsive, permanently hangs Kernel.Pause()
- issue · closed google/gvisor#14408: systrap: sentry unresponsive with stuck contexts; pod wedged in Terminating, only SIGKILL of sentry tree recovers
- issue · open google/gvisor#14548: shim: unbounded Init.mu hold across hung runsc kill; no escalation when the sentry stops answering
- PR · merged google/gvisor#14549: shim: bound runsc calls with a 30s deadline and WaitDelay
- PR · open google/gvisor#15182: systrap: keep waiting on a stuck context instead of killing it
Comments