My fix for this hang was already running. The sandbox hung anyway.
gVisor shifts its stub memory by a random gap, but since 2023 one queue was not moved with it. When the gap is small, that queue can land on a thread's stack and the sandbox can hang for good. The fix was one line.
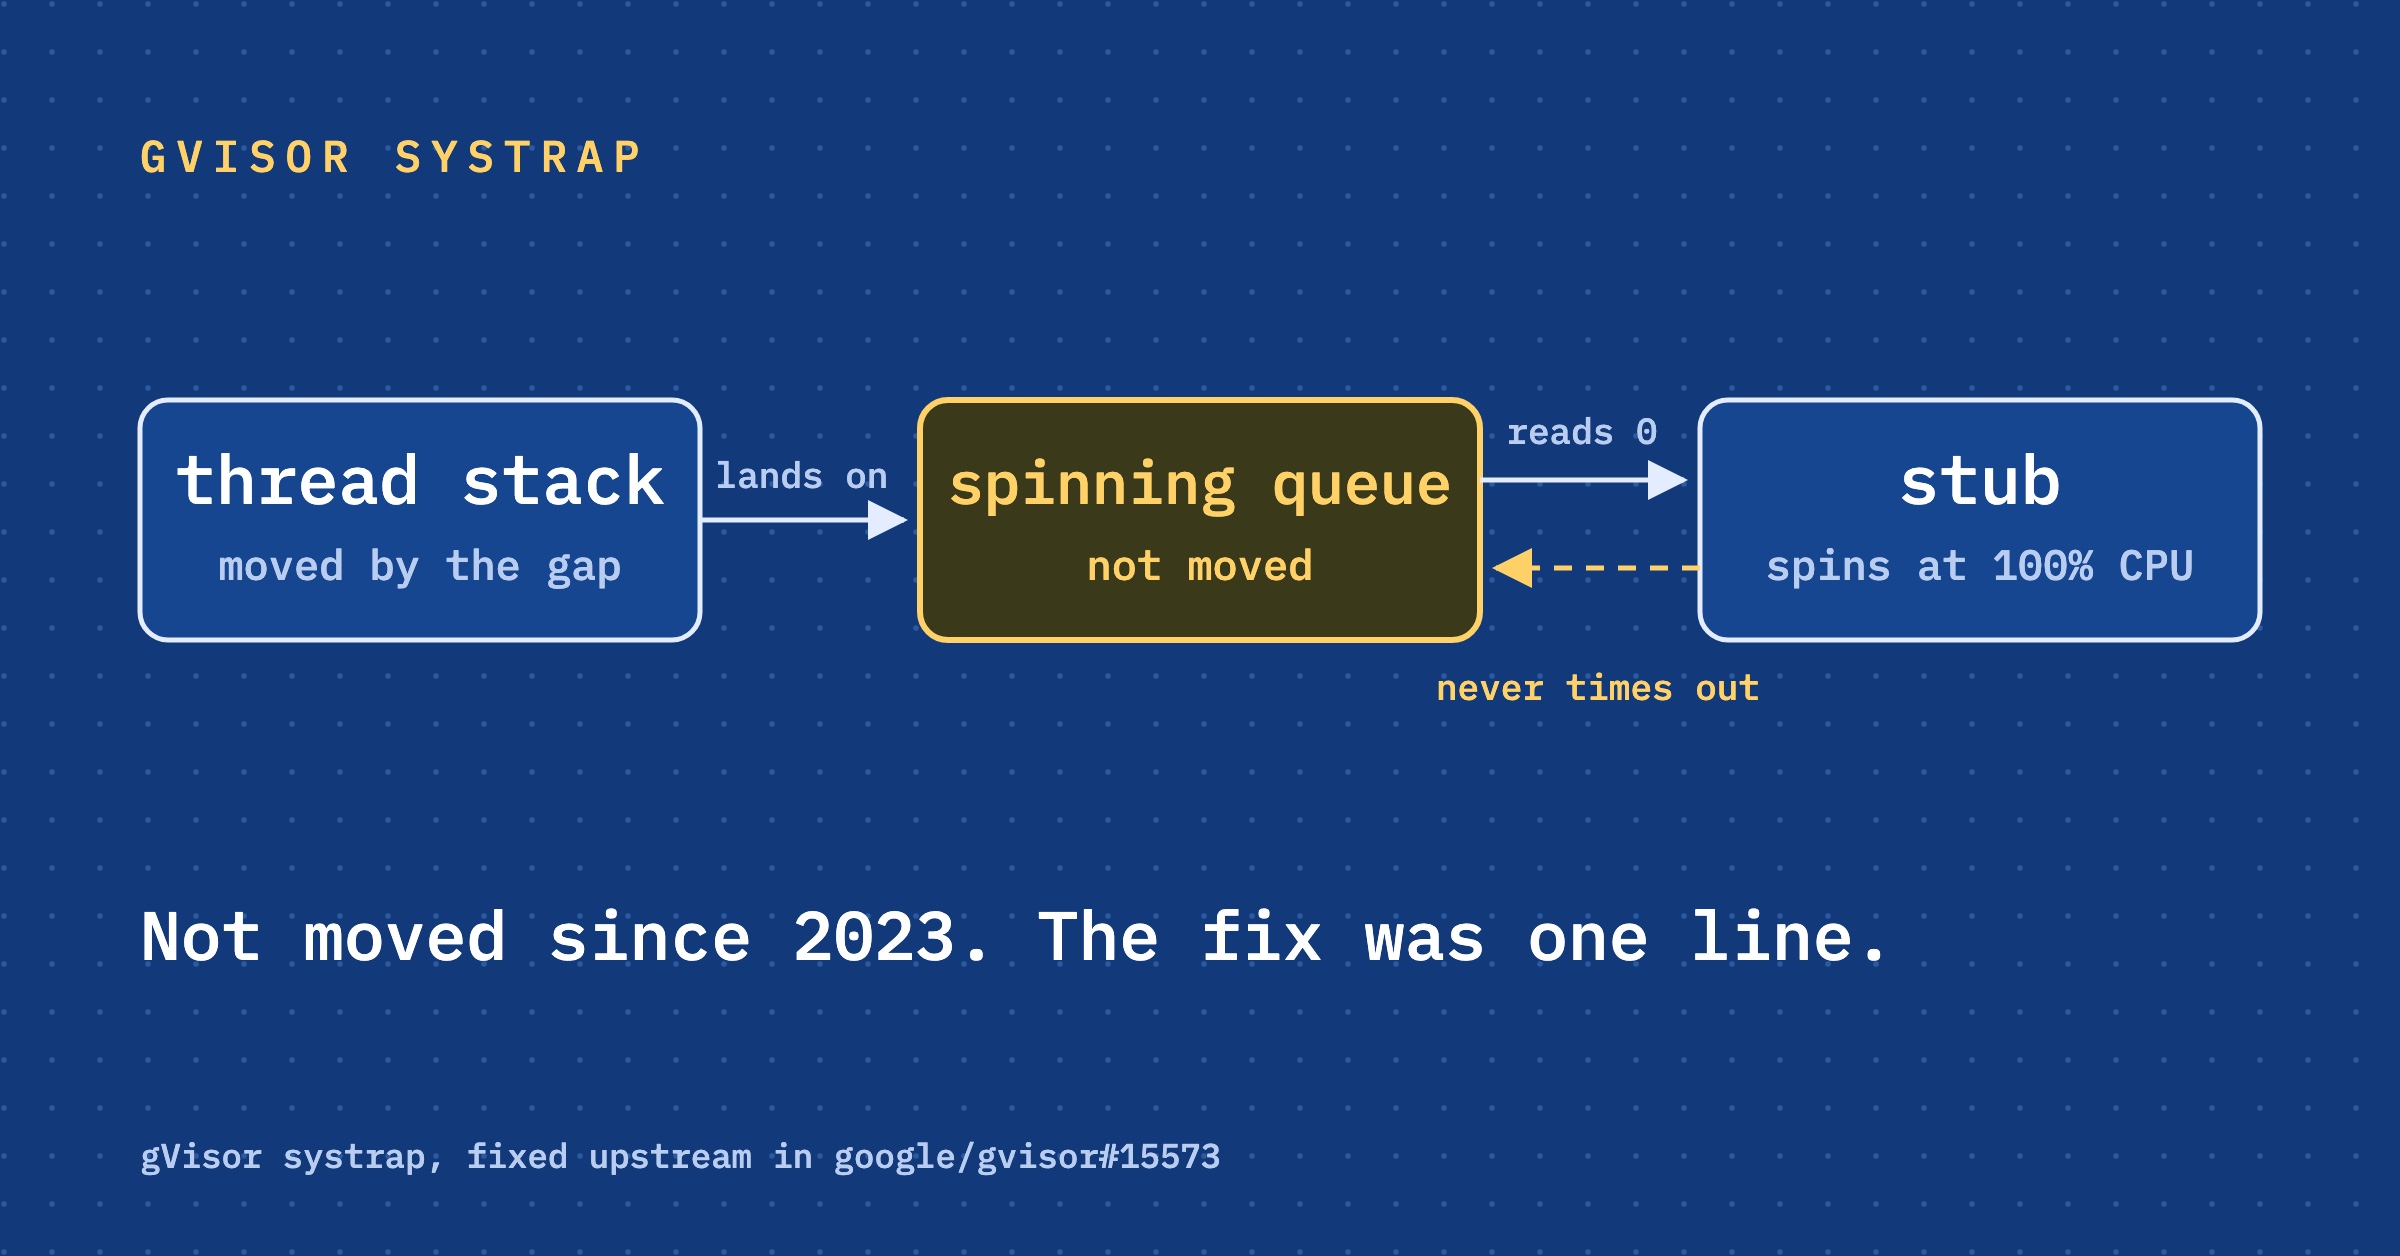
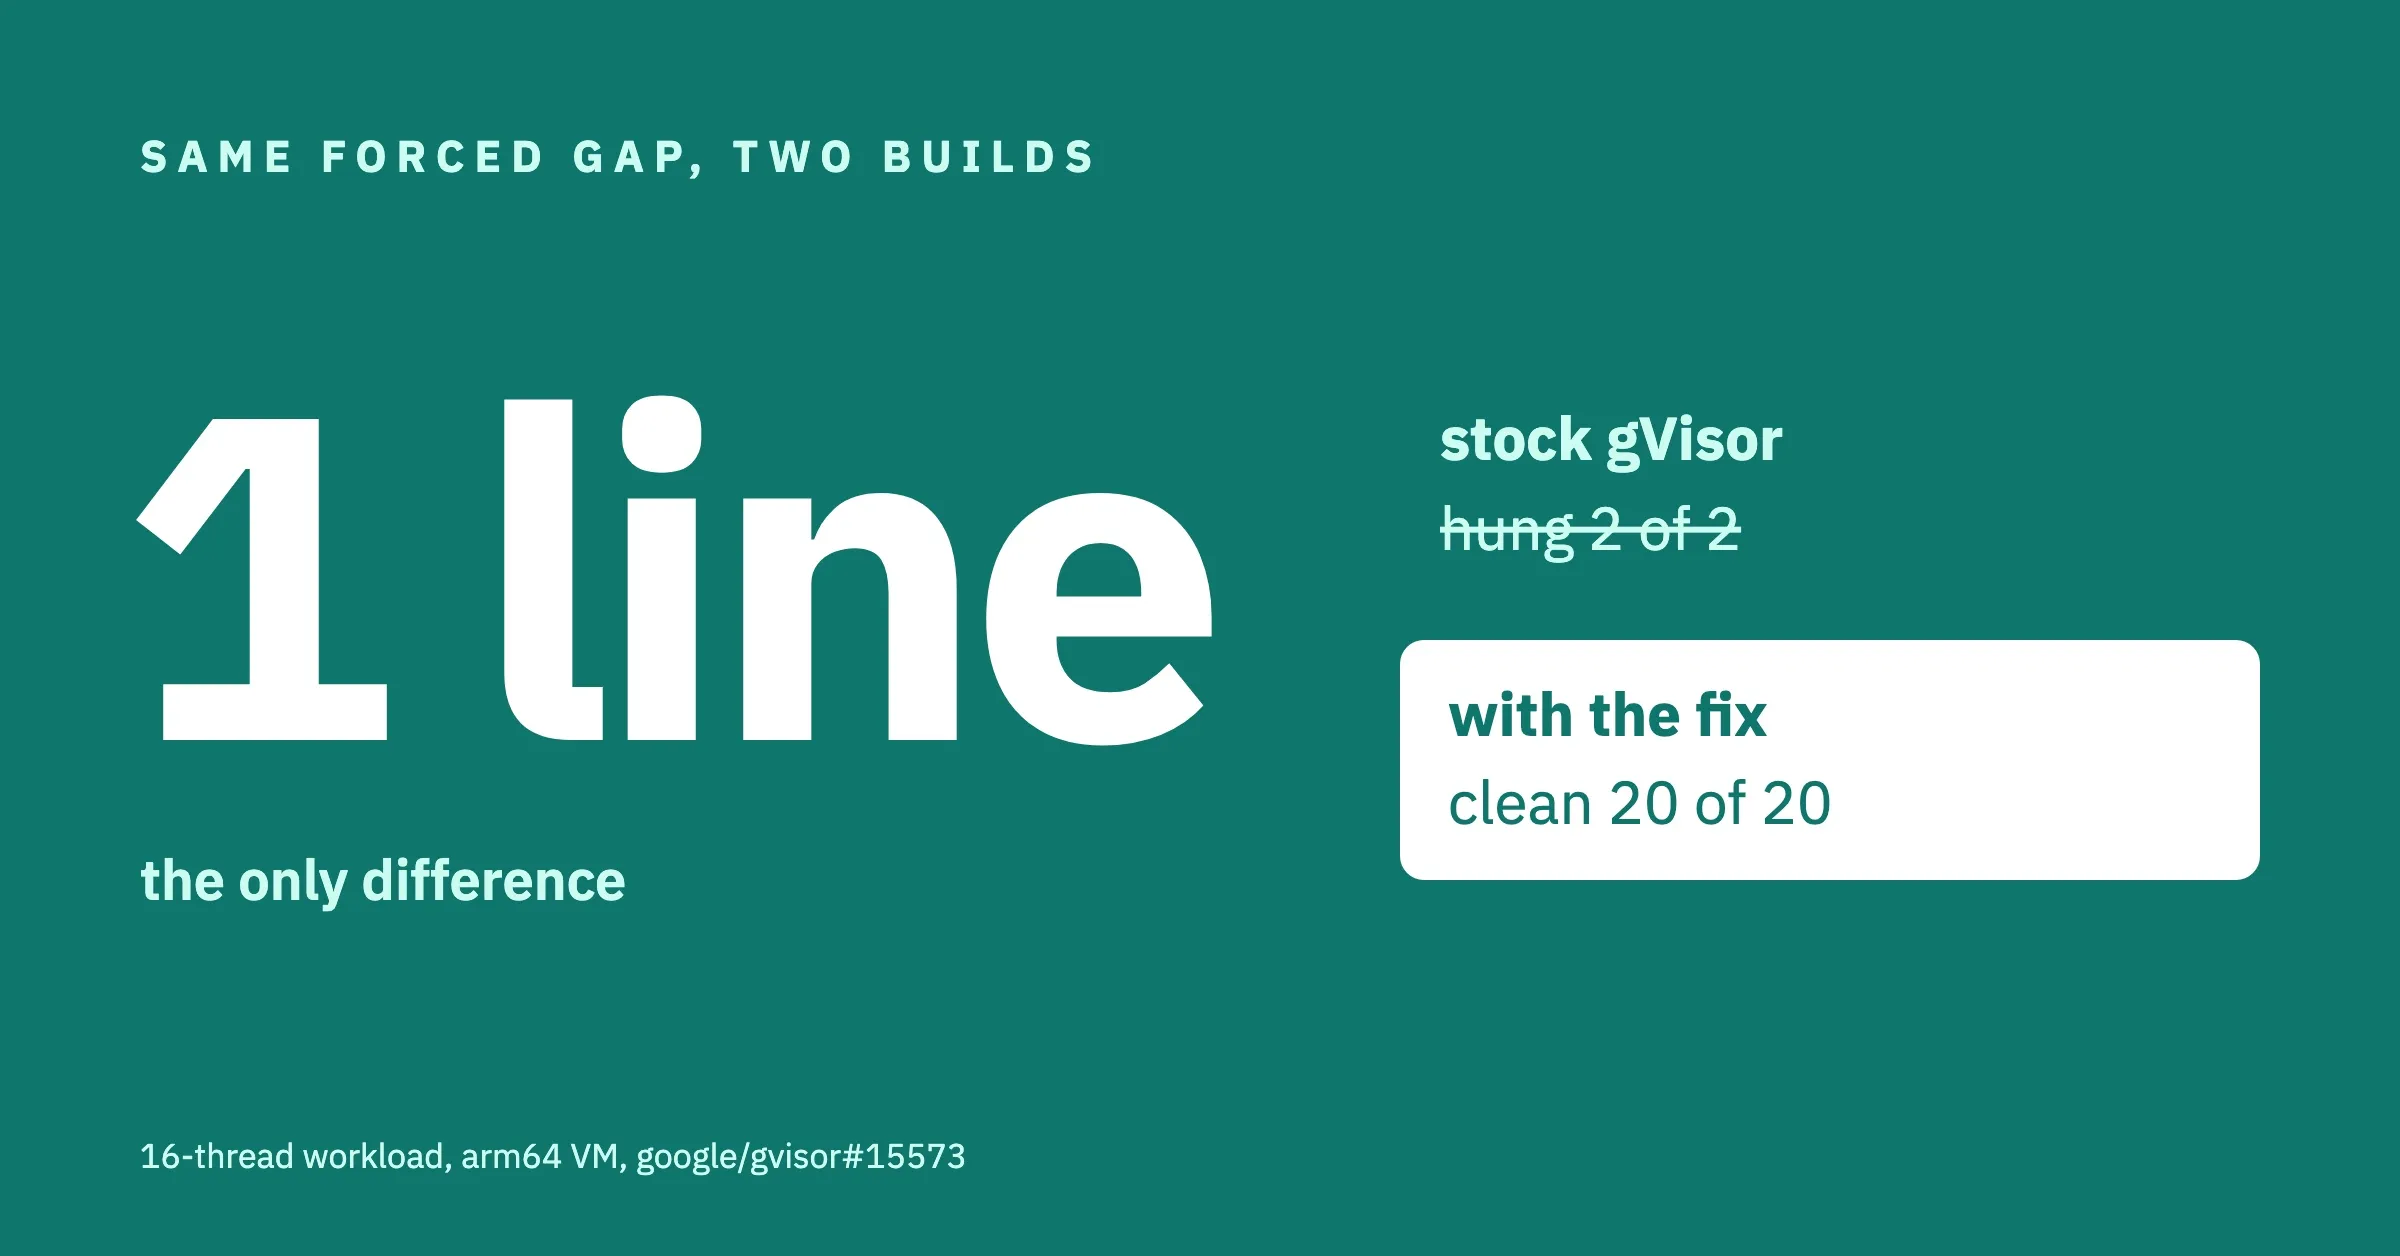
Same 16-thread workload. Same arm64 VM. Same forced memory layout. Stock gVisor hung 2 runs out of 2, with a stub process stuck at 100% of a core. Add one line, and it ran clean 20 times out of 20.
The only variable was where one queue sat in memory.
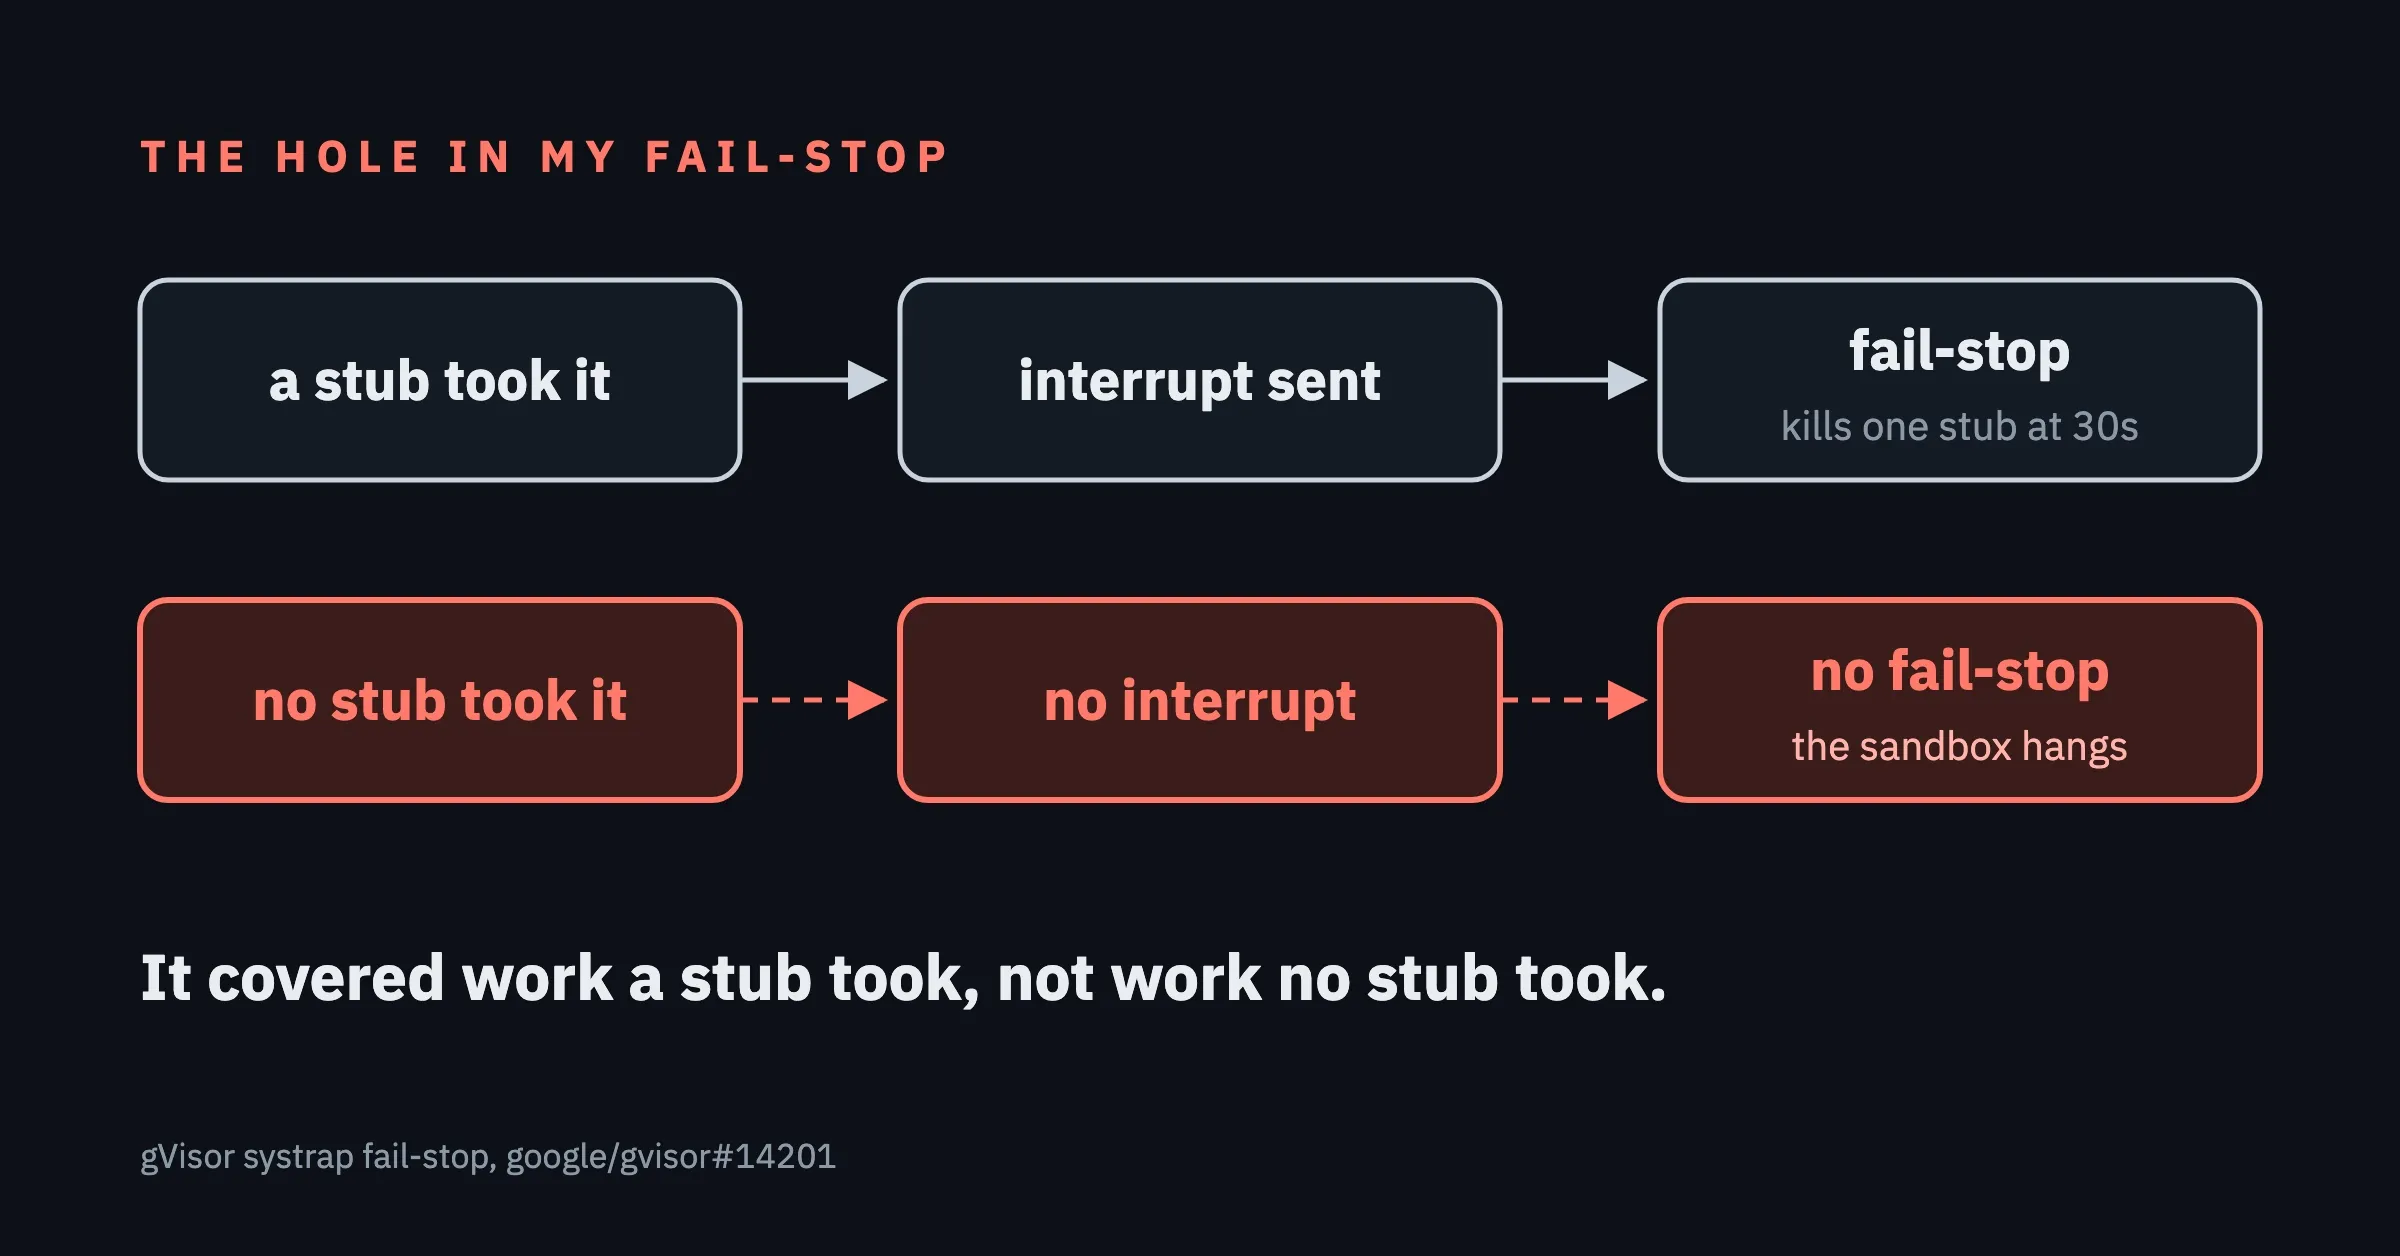
Getting to that line took me through my own safety net first. In August I had shipped a fail-stop to gVisor: if an app thread stays stuck for 30 seconds and gVisor's interrupt? doesn't free it, gVisor kills the one stub process running it instead of letting it hang the sandbox. A month later a handful of sandboxes hung with that fail-stop running. The fix is google/gvisor#15573.
gVisor, the short version
Deeper intro: gVisor, a kernel in Go.
gVisor runs a second kernel, the Sentry, written in Go, between the app and Linux. On its default platform, systrap, the app's code runs in host processes called stubs. The Sentry puts work for the stubs on a queue in shared memory, and every system call traps back to it.
Words marked with ? have a short definition: hover over them, or tap on a phone.
What did I think it was?
The bug from last time (gVisor: one lost signal): one lost interrupt left an app thread stuck. Same symptoms: pods stuck in Terminating, every Sentry thread asleep, hundreds of kills from Kubernetes queued behind one app thread that never paused.
One thing didn't match. Last time the stuck sandbox burned no CPU. This time a stub was burning a full core. And my fail-stop was supposed to catch exactly this kind of hang.
Why didn't my fail-stop fire?
A core dump of the Sentry showed one app thread waiting on its context?, with AckedTime=0 and an owner of 0xfefefefe, the "no thread" marker. No stub had picked it up since it was queued.
The fail-stop only fires once the Sentry has sent an interrupt, and the Sentry only interrupts a stub thread that took the context. Nobody took this one. No interrupt, no fail-stop.
So my safety net had a hole, and it was mine. It covered a stub that took the work and then stopped responding. It didn't cover work no stub ever took.
What was the stub doing at 100% CPU?
Every sample of the busy stub landed in one tight loop in spinning_queue_remove_first. It waits while the oldest entry's timestamp reads 0, since a new entry writes its timestamp last. Here it read 0 every time, and that check sits before the timeout check, so the loop never gives up.
Its other threads never took the context either. From the code, the Sentry only wakes another stub thread when none looks available (subprocess.go). The stuck spinner still counted as one.
Where was the queue, really?
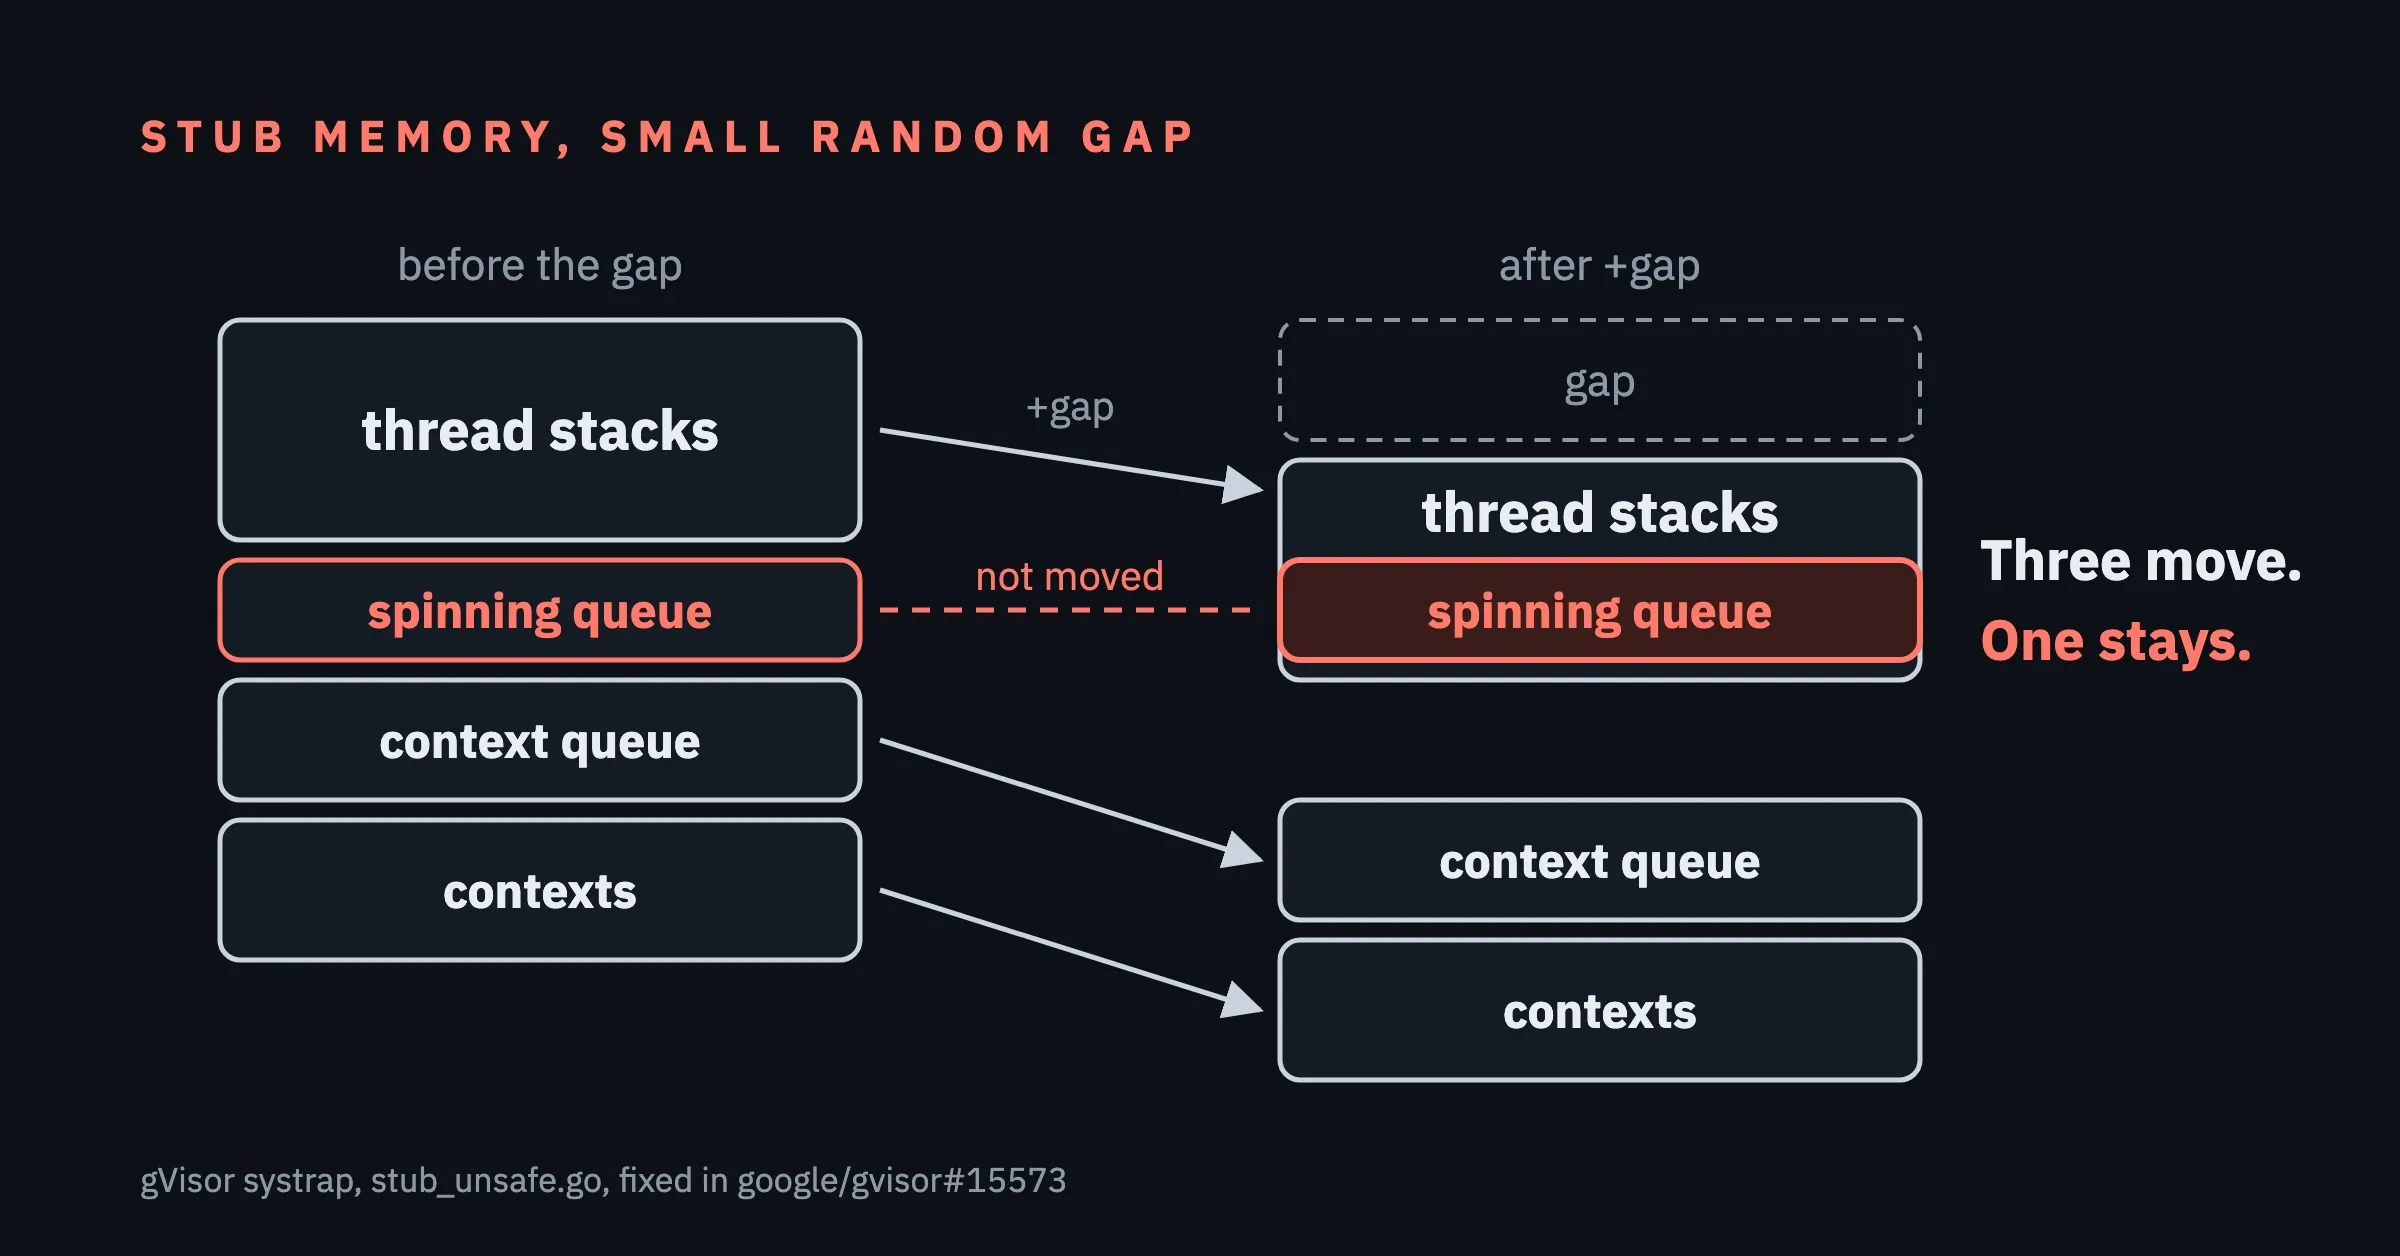
In the stub's /proc/<pid>/maps, the spinning queue?'s address wasn't in its own private page. It sat inside a per-thread stack mapping. Its start field read 0x7ff9, which is where the high half of a 0x00007ff9... pointer lands when a stack stores one there. The queue was reading a thread's stack as queue data.
How does a queue end up on a stack?
gVisor puts a random gap into the stub's memory layout, so attackers can't guess where things are. Every region after it has to move by the gap. Here is stub_unsafe.go before the fix, with the missing line marked by me:
gap := uintptr(rand.Uint64()) * hostarch.PageSize %
	(maximumUserAddress - stubStart - mapLen)
stubSysmsgStack += uintptr(gap)
stubContextQueueRegion += uintptr(gap)
stubContextRegion += uintptr(gap)
// missing: stubSpinningThreadQueueAddr += uintptr(gap)
Three regions move. The spinning queue, between them in the layout, stays put. With a big gap it sits alone in empty space. With a small one, the shifted stacks slide over its old address. It's been that way since the commit that introduced the spinning queue, in March 2023.
flowchart TB
  subgraph S["Inside the stub"]
    direction LR
    G[Small random gap] --> AL[Queue page overlapped<br/>by a thread stack] --> Z[Timestamp slot<br/>reads 0] --> SP[Stub spins<br/>100% CPU]
  end
  subgraph N["Inside the Sentry"]
    direction LR
    NA[Context never<br/>taken] --> W[No interrupt, so<br/>no fail-stop] --> K[Every kill<br/>waits behind it]
  end
  S --> N
  class AL,SP bug
It's an availability bug, not an isolation one: the queue lands on memory the stub could already write, which the Sentry treats as untrusted anyway. The damage stays inside the sandbox.
Why did it hide for three years?
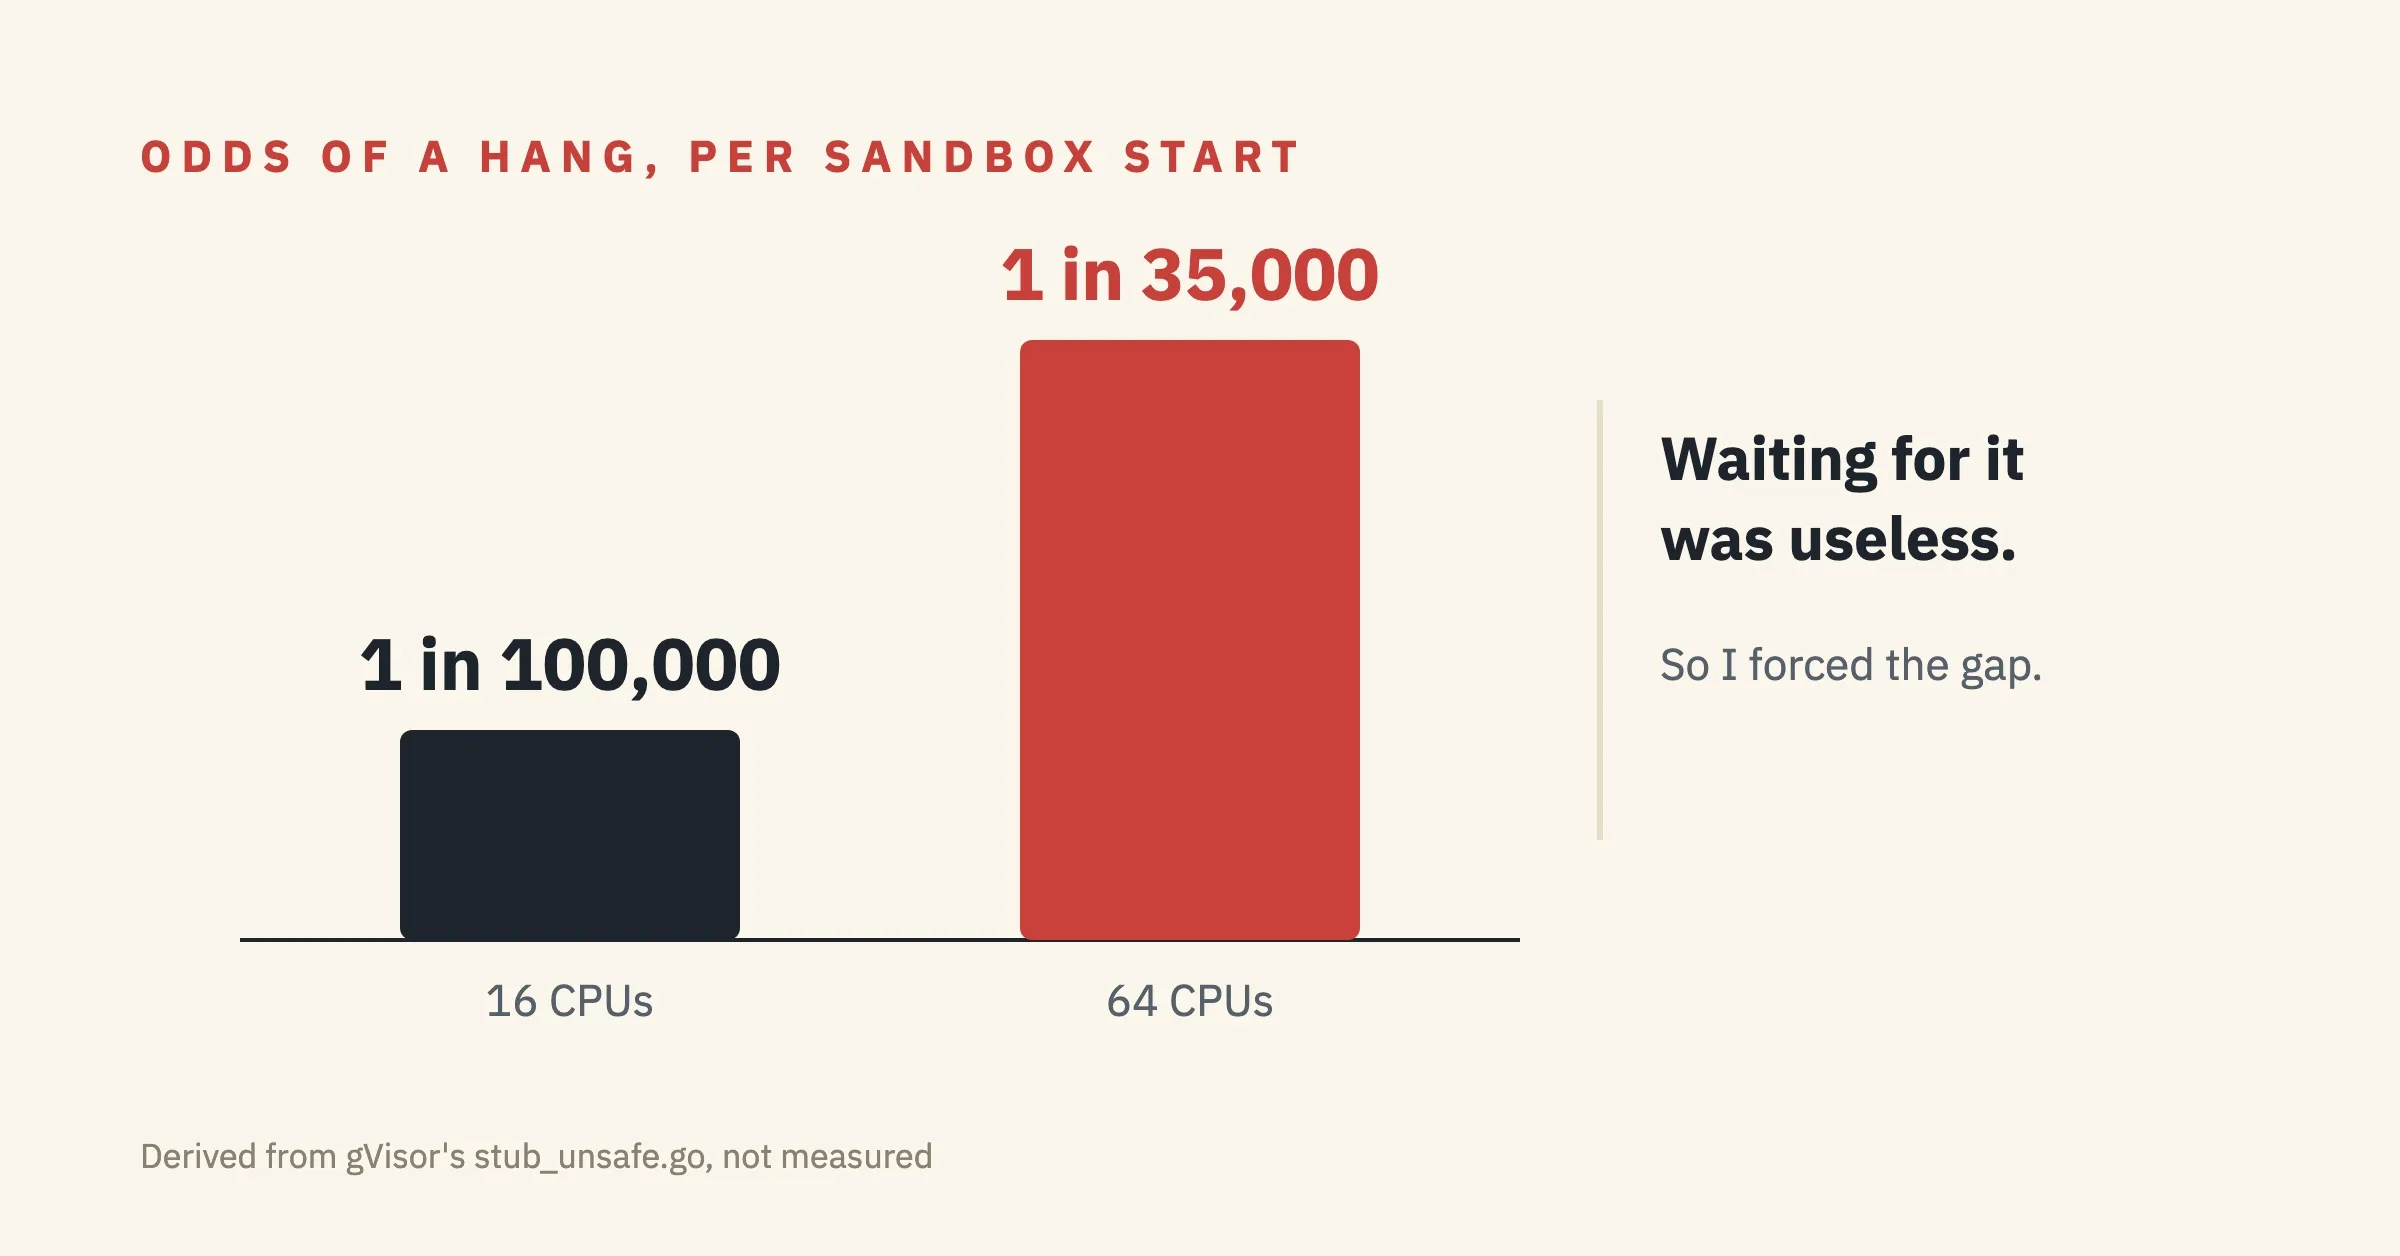
The gap is random below the room M left above the stub block, and M is itself random up to R, about 1 TiB on x86-64. The queue gets hit when the gap is smaller than the stack area T, about 612 KiB for a 16-CPU sandbox:
About 1 in 100,000 starts at 16 CPUs, and about 1 in 35,000 at 64. Waiting for it was useless.
Can I prove it with one variable?
So I forced it: a debug-only patch picks a gap that puts the old queue address inside a live thread stack.
| Build, same forced gap | Queue lands on a stack | Result |
|---|---|---|
| Stock gVisor | yes | hung 2 of 2, stubs at 100% CPU, no fail-stop log line |
Stock + stubSpinningThreadQueueAddr += uintptr(gap) | no, it moves with the gap | clean, 20 of 20 |
The code is shared by both architectures; arm64 was just faster to boot. The fix adds a layout test, and the repro tool is here.
Are you affected?
Systrap sandboxes on release-20230417.0 through release-20261005.0 can hit it; google/gvisor#15572 has details by version. The tell: a stub pinned at 100% forever, a pod stuck in Terminating, runsc kill hanging.
1. Upgrade to any runsc build that contains c7f458aa3, the first release after release-20261005.0.
2. Until then, --systrap-disable-fast-path (on release-20260622.0 or later) stops stub threads from spinning, so the spinning queue is never used. It's a partial workaround: it costs syscall latency, and a much rarer tiny gap can still hit the context queue. Only the upgrade fixes that.
3. To clear a hung sandbox, kill its Sentry on the host: the runsc-sandbox process ending with the pod sandbox ID from crictl pods. Its stubs die with it.
What did the AI do?
AI agents read the dump, mapped a program counter to a source line, built the VM repro and drafted the upstream PR. I made the calls, starting with not stopping at the hole in my own fail-stop.
A few things I'm keeping:
- Run the cheap check before the theory. One busy core killed my first guess.
- Your own safety net has holes, so look there first. Mine only covered work a stub had taken.
- Your debugging tool can kill the patient. A gcore of the Sentry faults in the sandbox's shared memory and can OOM it; dump the stub first.
- When a bug needs bad luck, make the bad luck happen on demand. A forced gap turned a 1 in 100,000 hang into 2 of 2.
The line is merged. That queue can't land on a stack anymore.
Thanks to @konstantin-s-bogom for reviewing and approving the fix, and to @avagin, who wrote the spinning queue and fixed the same symptom from a different cause in 2024 (google/gvisor#10000). Investigation assisted by Claude Code, with Codex as a second reviewer.
References
- Original First published on LinkedIn
- issue · closed google/gvisor#10000: We've had another instance of the process reporting 100% CPU load consistently after a certain point and know that the process literally did nothing (apart from listening to a socket, hosting an HTTP server... the usual stuff).
- PR · merged google/gvisor#14201: systrap: fail-stop sentry on stuck context
- issue · closed google/gvisor#15572: systrap: spinning queue isn't shifted by the stub gap, aliases a sysmsg stack and wedges the sandbox
- PR · merged google/gvisor#15573: systrap: shift the spinning queue by the stub gap
Comments